How to hide the axes but keep the grid?
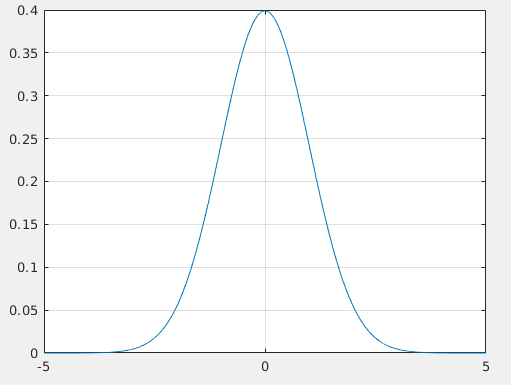
如果我们有身材
我们得到这样的东西
但是现在,我希望隐藏轴,所以我尝试了以下命令:
他们一起成功地隐藏了轴,但是网格也被删除了!
set(gca, 'xticklabel', [])可以隐藏标签,但不能隐藏轴。
那么,如何隐藏轴,刻度线和标签,而只保留绘图和网格?
- 我从python / matplotlib的angular回答(读得足够清楚...),但是不确定在Matlab本身中是否正确,因此我删除了答案。有关python matplotlib的信息,请参见tick_params。也许这会有所帮助。
-
@BrendanCox谢谢,我看到了你的回答,但是即使在matplotib中,我也看到你仍然没有隐藏轴。
-
您是否尝试隐藏ticklabels而不是ticks?
-
@avermaet是的,它不会删除网格,但是轴仍然在那里。
-
轴是什么意思? XTicks?或box off
-
啊,所以您想隐藏轴线本身?在matplotlib中,这似乎是通过spines属性完成的。看到这个答案
-
@avermaet他们两个。所有四个边框(顶部,底部,左侧,右侧)的box off。
-
figure; plot(x,y); ax=gca; ax.GridColor=b;为您工作吗?如果是这样,您可以尝试将轴的颜色更改为与背景相同的颜色,以使它们不可见。然后使用上面的方法使网格变黑或您想要的任何颜色。
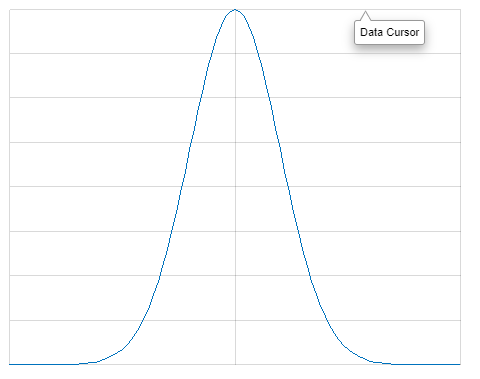
您可以将Xcolor和Ycolor设置为none,这样就不会显示轴:
1
2
3
4
5
6
7
8
9
10
| %dummy data
x = [- 5:.1: 5];
y = normpdf (x, 0, 1);
plot(x, y );
%grid on
grid on;
%Set the axis color to none.
set(gca, 'XColor', 'none', 'Ycolor', 'none') |
我不确定我是否了解您想要实现的目标,但是如果这就是您的意思,
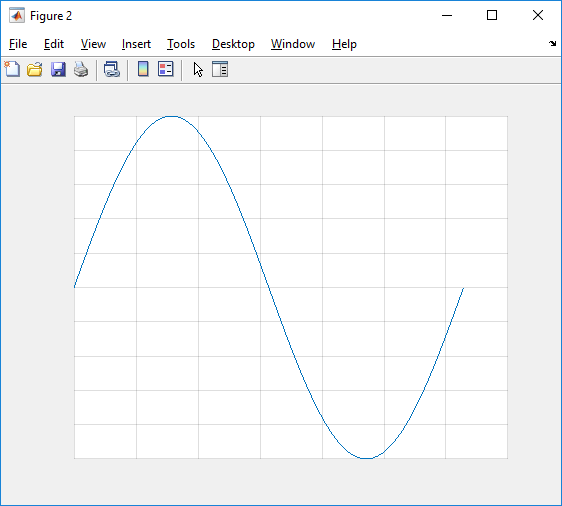
方法如下:
1
2
3
4
5
6
7
8
9
10
11
12
13
14
15
16
17
18
19
| function [] = q57076281 ()
% Plot some data with a grid:
x = linspace(0, 2* pi, 100);
y = sin(x );
figure(); hP = plot(x,y ); hAx = hP. Parent;
grid(hAx, 'on');
% Remove the box:
box(hAx, 'off');
% Hide the labels:
set(hAx, 'XTickLabel', [], 'YTickLabel', []);
% Hide the axes:
hXl = struct(hAx. XAxis). Axle; hXl. Visible = 'off';
hXl = struct(hAx. YAxis). Axle; hXl. Visible = 'off';
% Hide the ticks:
hAx. TickLength = [0, 0]; |
- 该struct包装器技巧很容易用于直接属性引用,但是会发出警告(至少在R2017b中)。使用hXl = get( hAx.XAxis, Axle );可能是更好的做法。有趣的是,用直接set命令替换Visible属性的中间变量hXl似乎不起作用...


