labeling x-axis with dates in geom_line in ggplot2
我想绘制一个工作日(即不包括周末和节假日)的时间序列图:如果我只使用ggplot,x轴上的日期和y轴上的y,则星期一和星期二之间的距离将与 星期五和星期一之间的距离。 下面是带有日期列的每日数据集。
1 2 3 4 5 6 7 8 9 10 11 12 13 14 15 16 17 18 19 20 21 | df <- structure(list(PROCEDURE_DATO_DATO = structure(c(17533, 17534, 17535, 17536, 17539, 17540, 17541, 17542, 17543, 17546, 17547, 17548, 17549, 17550, 17553, 17554, 17555, 17556, 17557, 17560), class ="Date"), Antal_akutte = c(17, 31, 22, 18, 25, 26, 20, 20, 21, 19, 25, 26, 27, 14, 14, 39, 21, 23, 20, 13), Antal_besog = c(42L, 60L, 58L, 58L, 56L, 61L, 44L, 48L, 47L, 44L, 58L,60L, 58L, 45L, 38L, 73L, 49L, 50L, 53L, 40L), Andel = c(0.404761904761905, 0.516666666666667, 0.379310344827586, 0.310344827586207, 0.446428571428571, 0.426229508196721, 0.454545454545455, 0.416666666666667, 0.446808510638298, 0.431818181818182, 0.431034482758621, 0.433333333333333, 0.46551724137931, 0.311111111111111, 0.368421052631579, 0.534246575342466, 0.428571428571429, 0.46, 0.377358490566038, 0.325)), .Names = c("PROCEDURE_DATO_DATO","Antal_akutte","Antal_besog","Andel"), row.names = c(NA, -20L), class = c("tbl_df","tbl","data.frame")) |
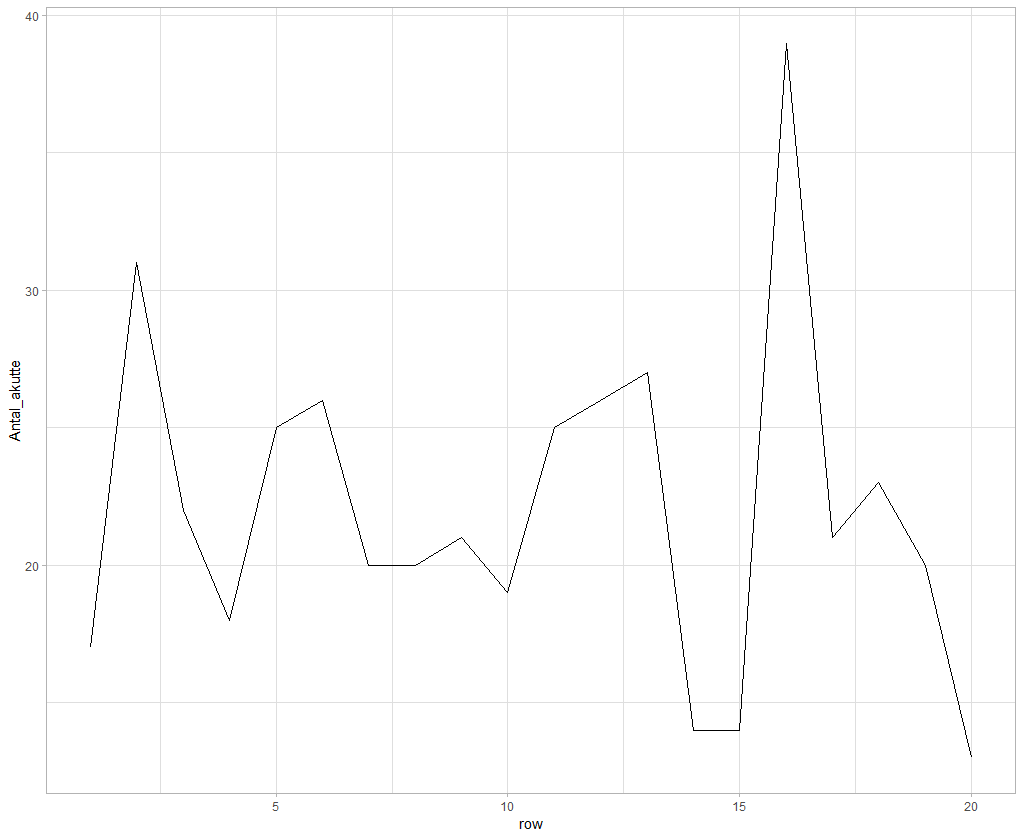
如果我只是简单地创建row_number,那么我会松开轴上的日期。
如何使用行号,但用日期列标记轴?
1 2 3 4 | df %>% mutate(row = row_number()) %>% ggplot(aes(row, Antal_akutte)) + geom_line() |
如果我尝试使用scale_x_continues创建标签,则会收到错误消息:
1 2 3 4 5 6 | data %>% mutate(row = row_number(), PROCEDURE_DATO_DATO = as.character(PROCEDURE_DATO_DATO)) %>% ggplot(aes(row, Antal_akutte)) + geom_line() + scale_x_continuous(labels = seq.Date(as.Date("2018-01-02"), as.Date("2018-12-31"), by ="q")) |
Error in f(..., self = self) : Breaks and labels are different lengths
您可以将数据转换为可扩展时间序列(xts)对象,这使使用时间序列变得非常容易。 然后使用
1 2 3 4 5 6 7 8 9 | # load libraries library(ggplot2) library(xts) # create an xts object (an xts object is formed by the matrix of observations, ordered by an index of dates - in your case `df$PROCEDURE_DATO_DATO`) df_xts <- xts(df[,-1], order.by =df$PROCEDURE_DATO_DATO) # make the plot autoplot(df_xts, geom="line") |
让我们列出一些观察结果,包括从一月开始的第一个周末:
1 2 3 4 5 6 | > df_xts[3:6,] Antal_akutte Antal_besog Andel 2018-01-04 22 58 0.3793103 2018-01-05 18 58 0.3103448 2018-01-08 25 56 0.4464286 2018-01-09 26 61 0.4262295 |
我将使用

更新:要绘制没有周末日期的图表,您的解决方案应该可以:
1 2 3 | df <- df[3:6,] %>% mutate(row=row_number(), PROCEDURE_DATO_DATO=as.character(PROCEDURE_DATO_DATO)) ggplot(df, aes(row, Antal_akutte)) + geom_line() + scale_x_continuous(breaks = df$row, labels=df$PROCEDURE_DATO_DATO) |
