matplotlib 3d axes ticks, labels, and LaTeX
我正在运行此示例脚本,并进行了以下修改:
1 2 3 4 5 6 7 8 9 10 11 12 13 14 15 16 17 18 19 20 21 22 23 | import matplotlib as mpl from mpl_toolkits.mplot3d import Axes3D import numpy as np import matplotlib.pyplot as plt mpl.rcParams['legend.fontsize'] = 10 fig = plt.figure() ax = fig.gca(projection='3d') theta = np.linspace(-4 * np.pi, 4 * np.pi, 100) z = np.linspace(-2, 2, 100) r = z**2 + 1 x = r * np.sin(theta) y = r * np.cos(theta) ax.plot(x, y, z, label='parametric curve') ax.legend() ax.set_xlabel('$X$', fontsize=20, rotation=150) ax.set_ylabel('$Y$') ax.set_zlabel(r'$\\gamma$', fontsize=30, rotation=60) ax.yaxis._axinfo['label']['space_factor'] = 3.0 plt.show() |
如何调整轴刻度以适应我的选择? 即,如何将z轴仅标记为2、0和-2以及所需的字体大小? 我知道如何以2D而非3D方式进行。
上面的脚本产生以下内容:
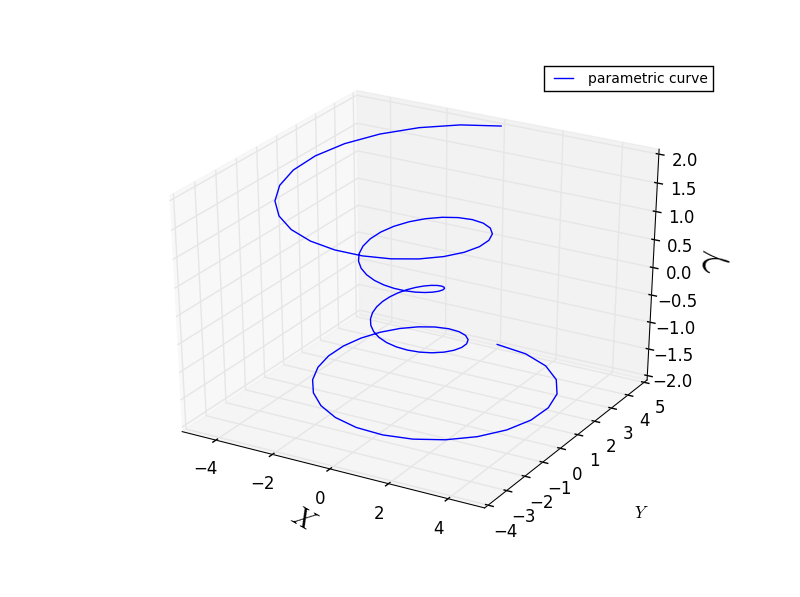
为什么我要对此脚本执行的x轴标签变形,而z轴标签(gamma)却不变形? 这根本不符合逻辑。 我需要用希腊字母标记的轴。 我该如何解决?
How do I adjust the axis ticks to that of my choosing? I.e., how would
I get the z-axis to only label 2, 0, and -2, and in the font size that
I want? I know how to do this in 2D but not 3D.
您必须更改
Why is the x-axis label distorted, which I wanted to do with this
script, but not the z-axis label (gamma)? This does not make sense. I
need this axis labeled in the Greek letter. How do I fix this?
您必须禁用z轴标签的自动旋转。 看下面的代码:
1 2 3 4 5 6 7 8 9 10 11 12 13 14 15 16 17 18 19 20 21 22 23 24 25 26 27 28 | import matplotlib as mpl from mpl_toolkits.mplot3d import Axes3D import numpy as np import matplotlib.pyplot as plt mpl.rcParams['legend.fontsize'] = 10 fig = plt.figure() ax = fig.gca(projection='3d') theta = np.linspace(-4 * np.pi, 4 * np.pi, 100) z = np.linspace(-2, 2, 100) r = z**2 + 1 x = r * np.sin(theta) y = r * np.cos(theta) ax.plot(x, y, z, label='parametric curve') ax.legend() ax.set_xlabel('$X$', fontsize=20) ax.set_ylabel('$Y$') ax.yaxis._axinfo['label']['space_factor'] = 3.0 # set z ticks and labels ax.set_zticks([-2, 0, 2]) # change fontsize for t in ax.zaxis.get_major_ticks(): t.label.set_fontsize(10) # disable auto rotation ax.zaxis.set_rotate_label(False) ax.set_zlabel('$\\gamma$', fontsize=30, rotation = 0) plt.show() |

for循环不是必需的,要更改刻度的大小,可以使用:
1 | ax.zaxis.set_tick_params(labelsize=10) |